 (c)XKCD Wisdom
It’s been a lot said and done on the field of engineering management metrics. But unfortunately, development teams have a very controversial perception of the metrics, thus it becomes more of the communication issue for the engineering managers or project managers, to introduce those metrics within a group.
Speaking of the metrics, I’ve ended up working on the following metrics, that helped me forecast the team productivity and products deliverables. I’m splitting these metrics, into 3 major categories, covering the overall task lifecycle, that can be scaled on all the projects:
- Management/Product metrics
- Development Metrics
- CI/CD Metrics
Management/Product Metrics
That’s where it all starts, we need an “idea”, that will later on be converted into the Task Specification, with a clear canvas of the problem domain the bussiness is trying to solve.
Lead Time for Change
Lead Time is the the total time that elapses from the moment when the work is started on a task until its completion
That’s where the problem can be held for a vast amount of time, bouncing back and forth from the Product and Design teams, untill it reaches Dev Team. You might say that it’s not really tech related metric, however it massively helps pinpointing the problems during the decision phase within the whole product/development chain. We can actually measure how long it takes before even a first commit lands into the project’s repository, and how long it took the Dev Team to accomplish the task.
Unfortunately, it might raise some tensions within Product and Dev teams, as it would show that developers aren’t the ones taking most of the time to deliver the feature. Mostly, it works in 80/20 case - when 80% of the time is taken by the Business/Product and only 20% remain for the development.
Development Metrics
Cycle Time
Cycle Time metrics measures the total time from the work started until it lends into the production system.
I prefer to think of Cycle Time as an actual metric that measures the delivery of the feature. That’s purely a development metrics. It include all the stages of Code Review, QA ping pong and finally the deployment. That’s where your 20% of Lead Time goes to.
Code Review
Code Review in itself, is a massive discipline, and might take huge amount of time for the teams where there are no properly set code guidelines, and styling guides. But, let’s assume, your team has these two in place, and you know what to look after in your Code Review step. If you don’t know what to look after in the Code Review step of the process - Google provides you with general guideline on how they did it. To summarise it all, during the Code Review, we check for:
- Code Design
- Functionality
- Complexity
- Tests
- Naming
- Comments
- Style
- Documentation.
If you still struggle on how to measure the Code Review, some of the engineering managers try to pay attention to the following parameters during the Code Review:
- Review Participation: You can’t review your own code.
- Review Speed: Fast doesn’t always mean good. Actually, it never means good.
- Review Depth: How deep should you refactor the code?
- Review Impact: Does the code introduce more limitations into the design?
Code Review is always a trade-off of continuous improvement of the code, and keeping the team’s workflow running.
Pull requests (PR’s) shouldn’t be hanging for the whole day in Code Review stage, unless it needs code refactoring, and it introduced more complexity than problem solving. That’s where we come to the Code Churn metric.
Code Churn
Code chunk, is a code quality metrics that indicates how often changes are made to a specific code block, during the development cycle.
Code churn oftenly measured by: [Lines Added] + [Lines Deleted] + [Lines Modified].
Code churn shows few major drawbacks during the production stage:
- Weakly formed task problem domain, and required solution. (When the problem domain reveals during the coding stage. Bad preps during Lead Time)
- Weakly designed solution. (Picking up wrong Pattern, not following good standards)
Documentation
Oh, how we love documentation stage! All of us, product and development teams. However, during the setup of this metric, I’ve always pushed the team to cover their end of the documentation process:
- Code: Documentation blocks in the source code is a must! (For teams own sake. You can’t remember everything, and you don’t have to!)
- Product: General description of an algorithm how it solves the product’s problem.
Once the Product team gets the solution from the algorithm description, they can use it on their end.
Development Throughput
Development throughput is a counter of work done per unit of time (sprint, quarter).
I, personally, don’t like this counter, but it helps showing the overall load on the Dev Team. If your Product and PgM teams do not inflate the workflow with meaningless tasks and don’t overuse “task decomposition” approach, your Development Throughput (DT) values will be more related to an actual real work.
CI/CD Metrics
Last but not the least, (DevOps Research and Assessment) DORA metrics, that I use to ensure that the team can perform in its top pick efficiency, and overall architecture is on point.
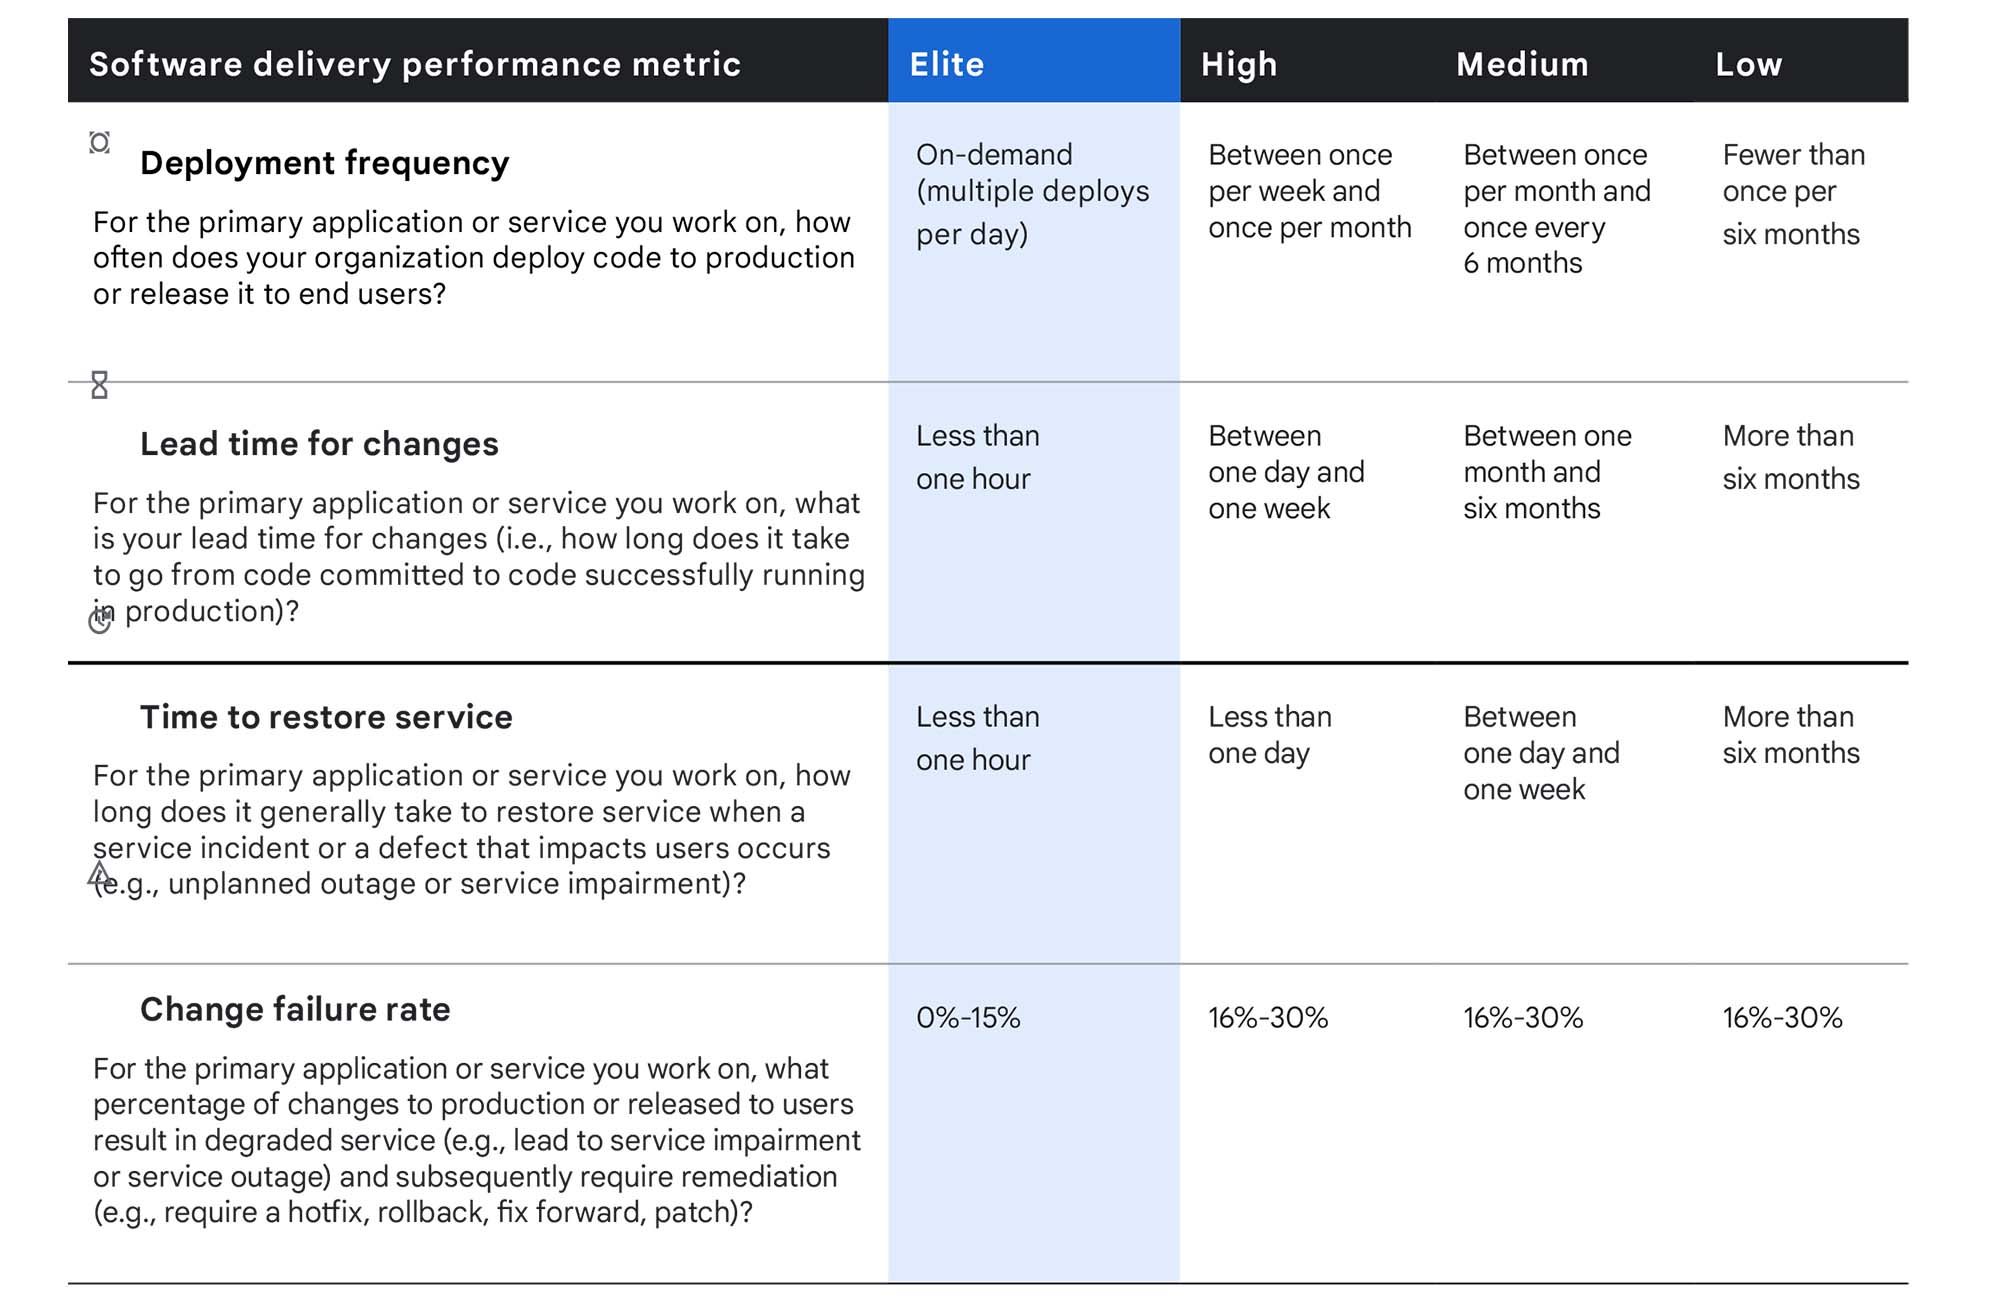
Change Failure Rate
Change failure rate is a percentage of code deployments that caused a failure in production
That’s where all the processes comes to a point of how many patches, hotfixes the team has to introduce, in case something went wrong during previous steps of development (weak QA, bad Code design, incorrect architectural decisions).
Deployment Frequency
Deployment Frequency can be calculated by dividing the total number of deployments made in a given time period by the total number of days in that period.
Planned releases take time, a lot of time. The longer it stays in the stage server, before the release, the more chances are that some other tasks will be merged into, breaking the concept of quick sprint releases. Continuous delivery works like charm, when the team can introduce incremental releases to the system, without breaking its behaviour.
“Sunny day” scenario is when the team can deploy the features on-demand, without baking the release.
Google provides an example of DORA metrics classification perfectly here:

Time to Restore Service
Also known as MTTR (Mean time to recovery or Mean time to Restore) is an average time it takes to recover from a product failure. The metrics calculates from the full time of the outage till the system becomes fully operational again.
Enough said by the definition of the metrics. Once it hits the fan, you better be able to fix it quick!